Restaurant Sales Reporting and Analytics: From Intuition to Data
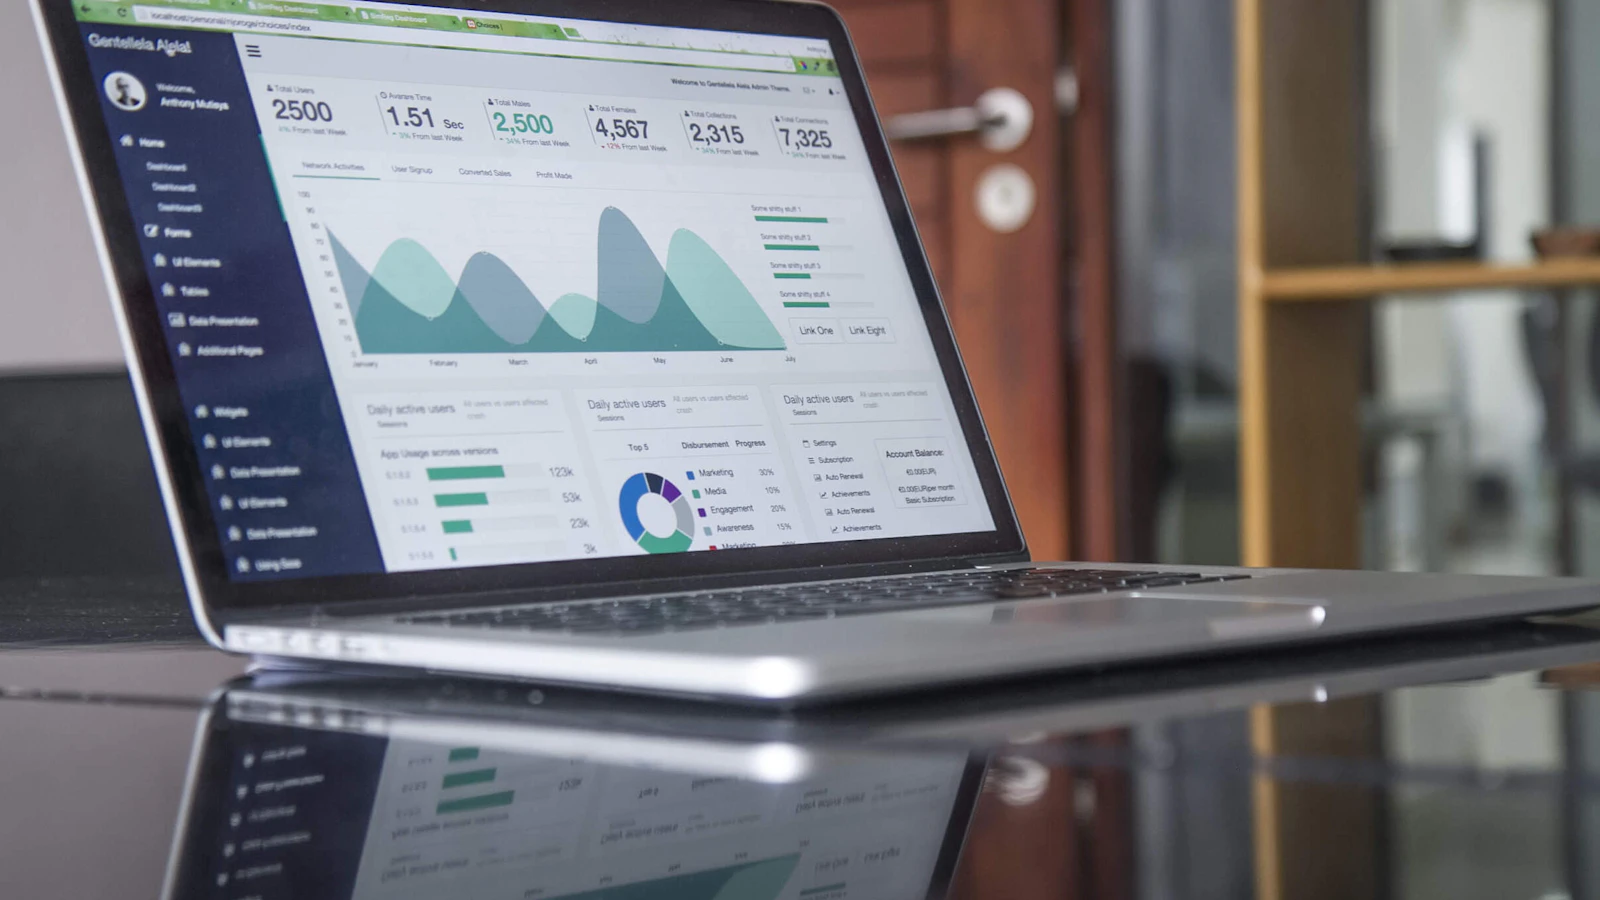
Sales reporting reveals top sellers, peak hours and average ticket size — moving decisions from intuition to data. A digital menu generates this data automatically; your job is to interpret and act.
Many decisions are still made by intuition. Yet a digital menu generates valuable data on every order. Learning to read it puts you ahead of competitors.
Key metrics to track
- Top sellers: know your stars
- Bottom sellers: spot removal candidates
- Average ticket size: measure your upsell success
- Peak hours/days: plan staffing and stock
- Category performance: which group dominates?
Turning data into action
Data alone doesn’t create value — decisions do. Peak hours drive shift planning; top sellers drive stock and supply; weak performers prompt menu revisions.

Build a regular analysis habit
- 1Weekly: peak hours and stock tracking
- 2Monthly: top/bottom sellers and category performance
- 3Quarterly: menu revisions and pricing review
- 4Seasonal: campaigns and special menus
Even five minutes a day reviewing reports produces concrete improvements by month’s end.
To turn data into menu changes, read menu engineering.
Digitize your menu with Dinematik
Try free for 7 days, no credit card required. Build your QR menu in minutes and serve your guests.
Frequently Asked Questions
No. A good panel turns data into visual charts — top sellers and peak hours are easy to read at a glance.
It depends on your business, but top sellers and average ticket size are critical starting metrics for nearly every venue.
A weekly quick look plus a monthly deep dive is a good rhythm. Increase frequency during seasonal peaks.
Related Articles
 Tips
TipsMenu Engineering: Designing Profitability in a Digital Menu
What is menu engineering, what do the four item categories mean, and how does a digital menu help you design profitability?
 Tips
Tips7 Proven Ways to Boost Sales with a QR Menu
From image use to upsell strategy — seven concrete methods to lift average ticket size with your QR menu.
 Business
Restaurant Digital Transformation: Where to Start, How to Move
Want to digitize your restaurant but unsure where to start? A practical, staged roadmap to digital transformation.